
2026 Manufacturing Executive Compensation Benchmarks
Manufacturing executive compensation is still moving in 2026, but the biggest change isn’t seen in base salaries. The more important shift is in the total compensation packages.
Boards are putting more weight on stock awards, annual incentives, and long-term incentives, while keeping fixed salary growth relatively restrained. A salary-only view can make the market look flatter than it really is, while a headline CEO-pay figure can make it look hotter than it is. The reality is that companies are still willing to pay for scarce leadership, but they’re directing more of that value into performance-linked compensation rather than guaranteed cash.
TL;DR
- Executive pay is still rising, but the strongest recent movement has come from equity and other incentive compensation rather than salary.
- Manufacturing is not one compensation market. Aerospace and defense, specialty chemicals, machinery, and auto-related businesses reward different kinds of executive performance.
- Total direct compensation is a better benchmark than salary alone because it captures base pay, bonus opportunity, and long-term incentive value.
- Manufacturing boards often emphasize capital efficiency, asset returns, and cash flow more heavily than general industry, which changes how incentive plans are built.
- The 2026 market is active but disciplined: manufacturer’s sentiment improved, but trade uncertainty and cost pressure are still shaping compensation decisions.
Table of Contents
The Biggest Compensation Trend in 2026 Is the Pay Mix
CEO Compensation is Up, But It’s Tied More to Performance
Median S&P 500 CEO compensation rose 9.7% in 2024 to $17.1 million. What matters more is how that increase was delivered. In the AP and Equilar analysis, median stock awards rose 14.7%, while median base salary rose 4% and performance-based bonuses rose just 0.8%. CAP’s 2026 early-filer review shows the same pattern carrying forward: median CEO total direct compensation was up 8% for 2025, with long-term incentive value up 9%, while salary rose 2.3%.
The data here suggests compensation committees still want to reward leadership, but they’re doing it in ways that preserve flexibility and keep more of the upside tied to performance.

Why Manufacturing Leans Harder Into Variable Pay
Many of the outcomes that boards care about cannot be judged in one quarter or solved with one operating decision. Capital allocation, plant modernization, supply-chain redesign, working-capital improvement, pricing discipline, and margin protection all play out over time. A board may be hesitant to lock in a much higher fixed salary when those outcomes are still being tested.
Long-term incentives and performance-linked awards solve that problem. They let a company offer competitive upside while reserving the biggest rewards for executives who actually improve returns, throughput, cost structure, or resilience. WTW’s industrial manufacturing analysis supports that logic directly: target total direct compensation growth has tended to outpace base salary growth, which means the market is moving more through incentive design than salary escalation.
That shift also changes how employers should think about recruiting. A package that looks competitive on salary can still lose if the incentive structure is weak, too short-term, or poorly aligned with the executive’s expected impact.
Why Pay Looks Different Across Manufacturing Subsectors
Aerospace and defense, specialty chemicals, industrial machinery, auto components, and electrical equipment don’t share the same economics, risk profile, or performance cycles, so why would they share the same compensation models?
The answer is: they don’t. Compensation committees are pricing the strategic difficulty of the business model the executive is stepping into rather than basing it completely on the title of the role.
How Compensation Changes in Each Subsector
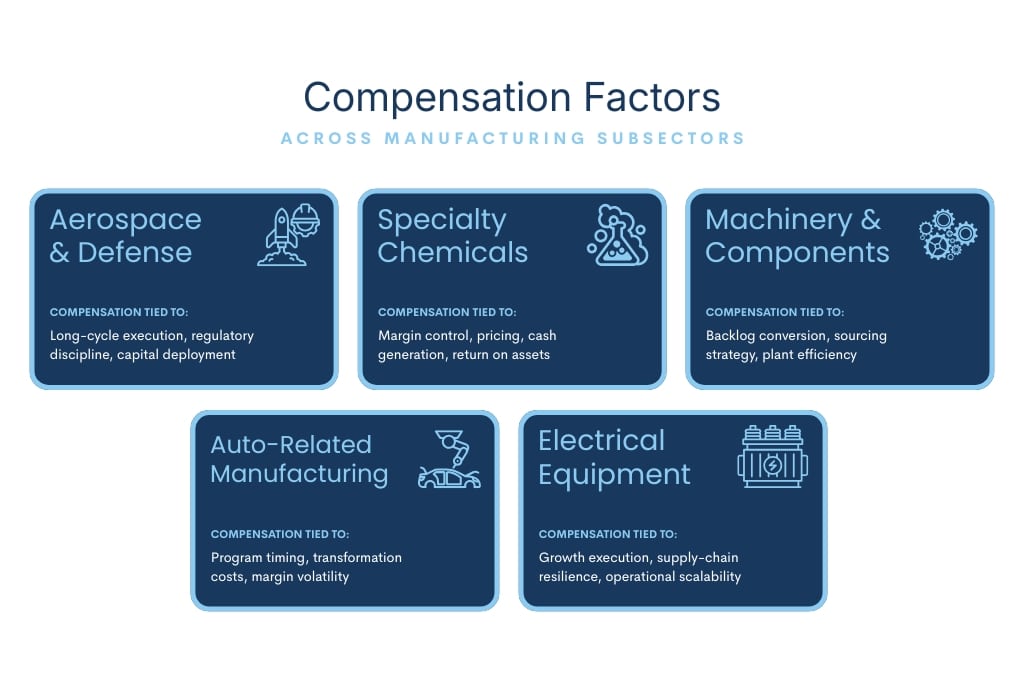
In aerospace and defense, executive performance is often tied to long-cycle execution, regulatory oversight, customer concentration, and disciplined capital deployment.
In specialty chemicals, the pressure often falls more heavily on margins, pricing, cash generation, and return on assets.
In machinery and industrial components, leadership value is often tied to backlog conversion, plant efficiency, sourcing strategy, and operational reliability.
In auto-related manufacturing, the pressure can be even sharper because program risk, transformation costs, product-cycle timing, and margin volatility can swing results more quickly.
The point is not that one subsector always pays more than another. The point is that each one tends to reward a different mix of judgment, timing, and operating discipline, so pay plans can’t be benchmarked intelligently unless those differences are acknowledged.
Total Direct Compensation Is a Better Benchmark Than Salary Alone
What is Total Direct Compensation?
Total direct compensation is usually the sum of base salary, annual incentive opportunity or payout, and the grant-date value of long-term incentives. When comparing pay at the executive level, this is the better benchmark because it reflects how boards actually price an executive role. Salary shows the guaranteed cash cost of hiring the person. Total direct compensation shows the full economic offer attached to the job.
Why Salary-Only Benchmarking Misreads the Market
A salary-only comparison creates two problems. First, it understates what companies are actually paying when more of the package sits in bonus or equity. Second, it makes two offers look comparable when they may be very different structurally. One company may offer a strong base with limited upside. Another may offer a moderate base but materially stronger long-term incentives. Those are not equivalent packages, and they don’t attract the same kind of candidate behavior.
Why Manufacturing Boards Structure Pay This Way
Manufacturing boards often lean into this structure because they’re measuring leadership against expensive assets and long-horizon decisions. WTW found that asset measures are 3 times as prevalent in industrial manufacturing as in general industry, and cash-flow measures are used about 70% more frequently.
WTW also found that total shareholder return is not the dominant long-term measure in this sector; return-oriented metrics such as return on invested capital (ROIC) often matter more. That means executives are frequently rewarded for using capital better, not just for growing revenue or benefiting from a rising market.
That helps explain why finance and operations leadership can command a stronger premium than a simple org chart might suggest.
2026 Benchmark Pay Ranges for Manufacturing Executive Roles
The ranges below reflect current 2026 salary benchmarks. These figures should still be read as base-salary benchmarks, not total compensation. Public-company executive packages can be much higher once annual incentives, equity, and long-term incentive awards are included.
| Role | 2026 Base Salary Range | 2026 Midpoint Salary |
| Chief Operating Officer | $426,500–$527,722 | $477,111 |
| Chief Financial Officer | $390,815–$489,934 | $440,375 |
| Chief Supply Chain Officer | $276,645–$342,696 | $309,671 |
| Chief Manufacturing Officer | $274,998–$341,809 | $308,404 |
| VP of Manufacturing | $208,955–$262,950 | $235,953 |
| Plant Manager | $175,879–$211,923 | $193,901 |
What Changed Over the Past Few Years
2026 Salary Midpoints Show Strong Growth From 2023 Levels
Manufacturing executive compensation has risen sharply since 2023, especially for roles tied to enterprise operations, finance, supply chain, and companywide manufacturing leadership.
| Role | 2023 Salary | 2026 Salary | Growth |
| Chief Operating Officer | $273,062 | $477,111 | +74.7% |
| Chief Financial Officer | $275,432 | $440,626 | +60.0% |
| Chief Supply Chain Officer | $239,748 | $309,136 | +28.9% |
| Chief Manufacturing Officer | $241,904 | $308,444 | +27.5% |
| Plant Manager | $165,578 | $193,901 | +17.1% |
| VP of Manufacturing | $204,029 | $235,998 | +15.7% |
The strongest movement is at the enterprise level. COO and CFO compensation shows the largest increase, which fits the broader pattern in manufacturing: companies are paying more for leaders who can manage capital decisions, cost pressure, operational complexity, and cross-functional execution.
The growth is still meaningful for plant and manufacturing leadership roles, but it’s not as steep. That difference matters for benchmarking. A company hiring for a plant manager, VP of Manufacturing, Chief Manufacturing Officer, CFO, or COO should not assume that one broad manufacturing pay trend applies evenly across all leadership roles.
Incentive Outcomes Remain Strong Post-Covid
CAP’s materials and industrials analysis gives us a look at the incentive side of compensation for manufacturing executives. Annual incentive payouts in the sector were above target at median in 2022, 2023, and 2024, with payouts around 125% of target in 2022 and 2023 before moderating to 109% in 2024. While the effects of COVID may have inflated these payouts a bit in recent years, we’re still seeing elevated payouts rewarding performance even after the post-COVID effects have dissipated. This means that the trend is likely here to stay.
What the 2026 Outlook Means for Executive Pay
Strong Sentiment, Cautious Spending
NAM’s first-quarter 2026 outlook survey showed that 75.3% of manufacturers felt positive about their company’s outlook, with expected sales growth of 3.8% and production growth of 3.5%.
However, the same survey also found that 70.6% cited trade uncertainty as a top business challenge, alongside healthcare and insurance costs and raw-material pressures. While boards may be optimistic about growth, they’re still paying close attention to some major concerns that could impact their profits. Because of this, companies may still be reluctant to increase salaries if the cost can’t be easily justified or tied to performance.
The Capabilities Manufacturing Companies Are Paying For
The most durable compensation premiums in 2026 are likely to remain attached to a fairly specific set of capabilities:
- Capital allocation and return discipline
- Margin protection and pricing judgment
- Operational transformation across plants or networks
- Supply-chain resilience in volatile trade conditions
Conclusion
Manufacturing executive compensation in 2026 is different than it has been in the past. Boards are relying more heavily on stock awards, annual incentives, and long-term incentives to reward leaders without overcommitting fixed cash. Companies assessing benchmark data for manufacturing executive salaries should pay close attention to the structure of their total compensation and should take into account the differences between subsectors within manufacturing.
Ultimately, the compensation that’s right for the executive you want to hire should be closely tied to the outcomes you want to see from the individual and should compensate for the unique set of skills the leader needs to possess.
If you’re looking for a new manufacturing executive or just want to talk to someone about compensation expectations, get in touch with the manufacturing team at The Richmond Group USA to begin your next executive search!